Research in context graph, Ricgraph, Ricgraph Explorer, Ricgraph REST API, Data enrichment, Data harvesting, Data linking, Enrichment, Graph, Graph database, Harvest, Harvest data, Harvester, Knowledge graph, Linked data, Metadata, Utrecht University, Visualization
Ricgraph - Research in context graph
1 What is Ricgraph?
Ricgraph, also known as Research in context graph, enables the exploration of researchers, teams, their results, collaborations, skills, projects, and the relations between these items.
Ricgraph can store many types of items into a single graph. These items can be obtained from various systems and from multiple organizations. Ricgraph facilitates reasoning about these items because it infers new relations between items, relations that are not present in any of the separate source systems. It is flexible and extensible, and can be adapted to new application areas.
Throughout this documentation, we illustrate how Ricgraph works by applying it to the application area research information.
2 Ricgraph introduction videos
You may want to watch the following videos about Ricgraph. The left one is a short video, only including the Ricgraph use cases. The right one is a more extensive one (also including the use cases).
| Ricgraph use cases video (1m30s) | Ricgraph introduction video including use cases (2m28s) |
| Click to play or download the Ricgraph use cases video. | Click to play or download the Ricgraph introduction video. |
3 Motivation
Ricgraph is software that is about relations between items. These items can be collected from various source systems and from multiple organizations. We explain how Ricgraph works by applying it to the application area research information. We show the insights that can be obtained by combining information from various source systems, insight arising from new relations that are not present in each separate source system.
Research information is about anything related to research: research results, the persons in a research team, their collaborations, their skills, projects in which they have participated, as well as the relations between these entities. Examples of research results are publications, data sets, and software.
The following sections show three use cases that use different types of information (called items): researchers, skills, publications, etc. Most often, these types of information are not stored in one system, so the use cases may be difficult or time-consuming to answer. However, by using Ricgraph, these use cases (and many others) are easy to answer, as will be explained throughout this documentation.
Although this documentation illustrates Ricgraph in the application area research information, the principle “relations between items from various source systems” is general, so Ricgraph can be used in other application areas.
3.1 Use case for a journalist
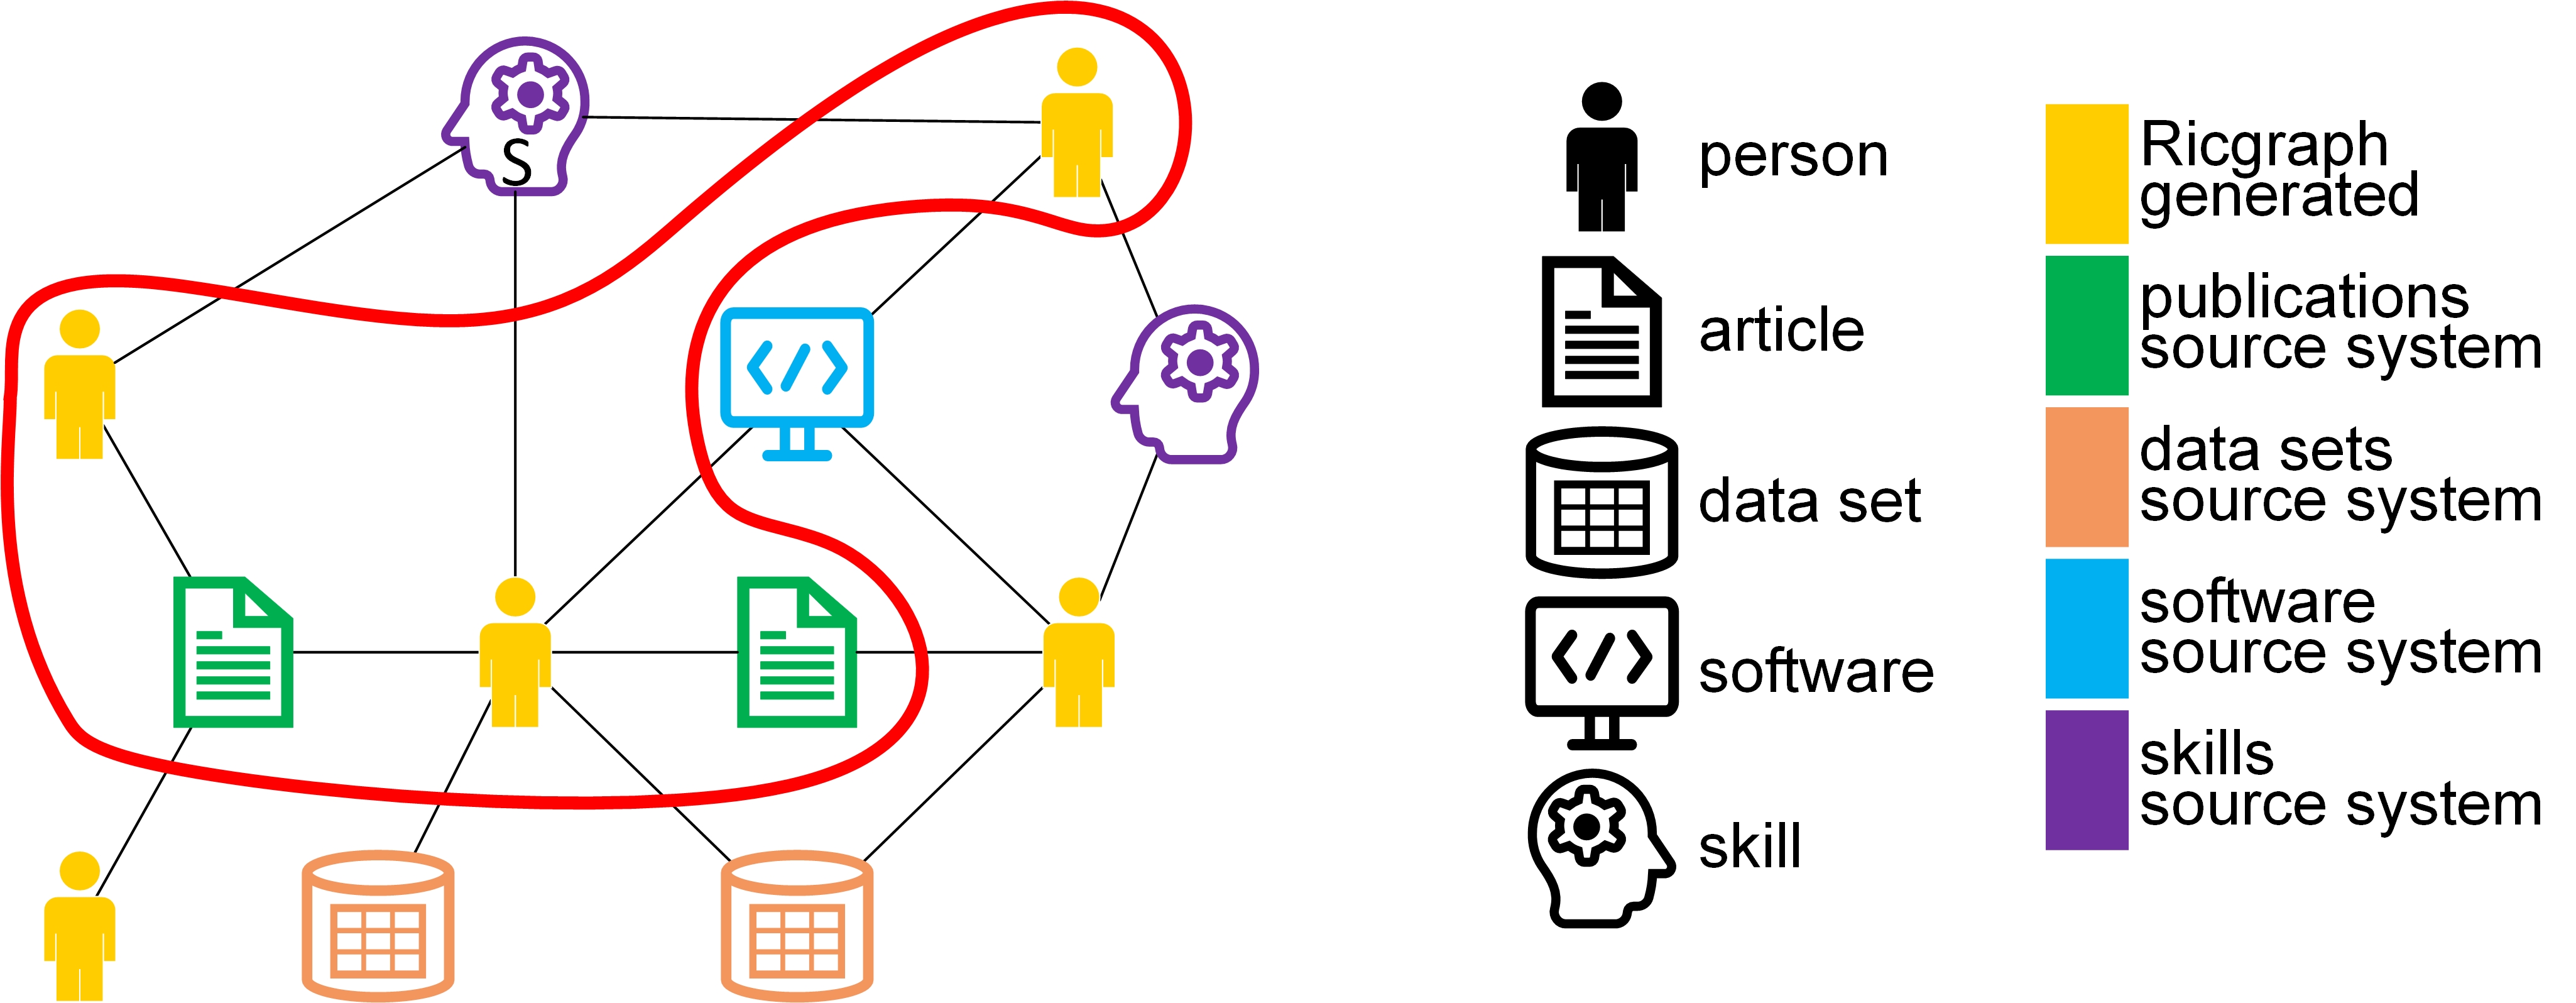
As a journalist, I want to find researchers with a certain skill S and their publications, so that I can interview them for a newspaper article. Example skills can be: climate change or stem cells. The items surrounded by the red line are the solution to this use case.
3.2 Use case for a librarian
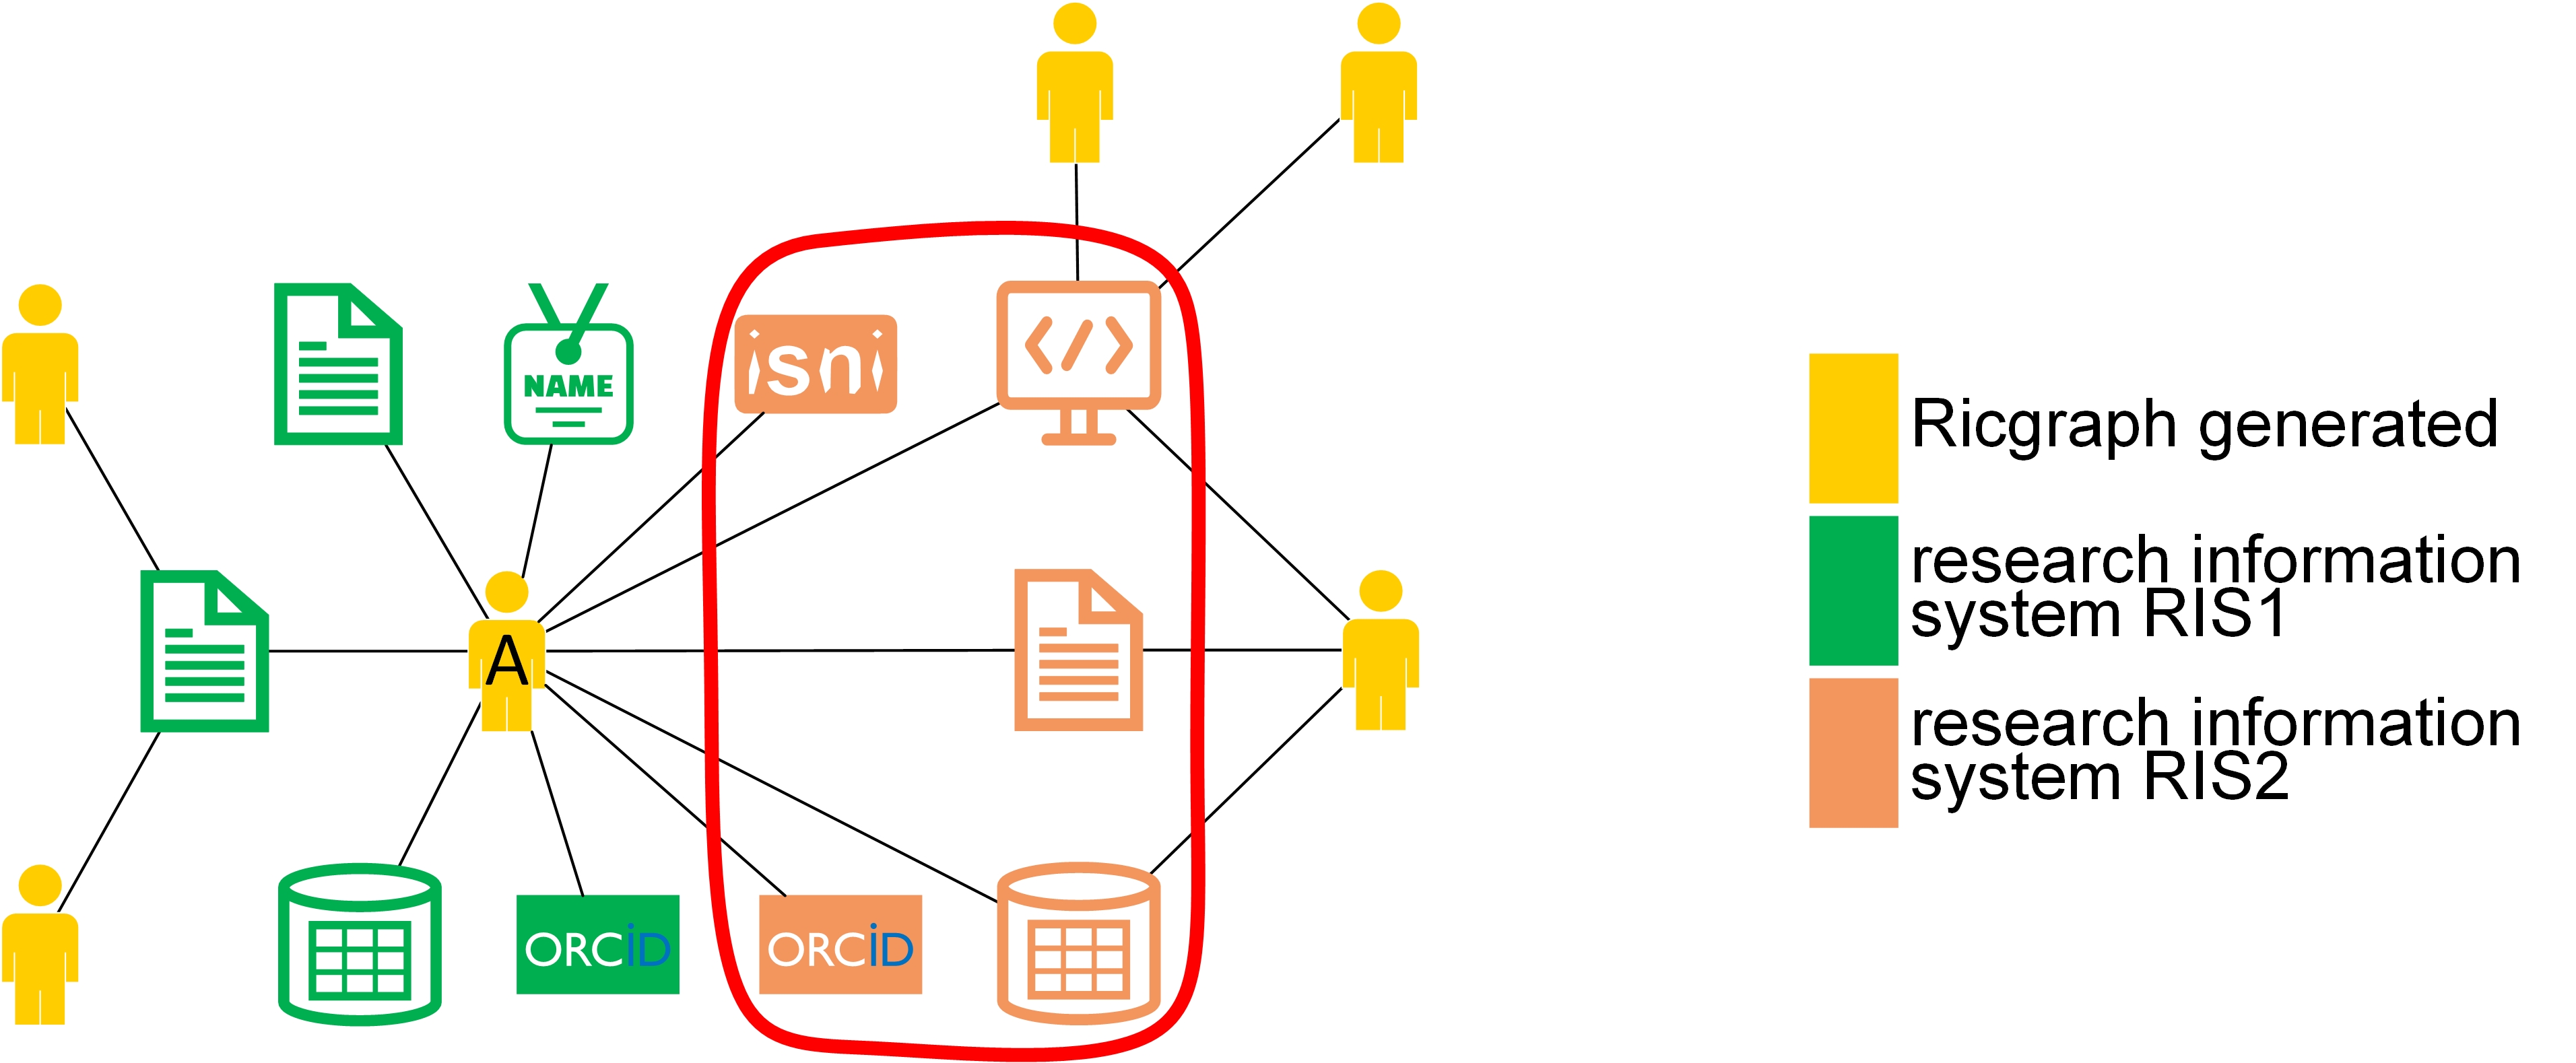
As a librarian, I want to enrich my local research information system with research results from person A that are in other systems (in orange, RIS2) but not in ours (in green, RIS1), so that we have a more complete view of research at our university. The items surrounded by the red line are the solution to this use case.
3.3 Use case for a researcher
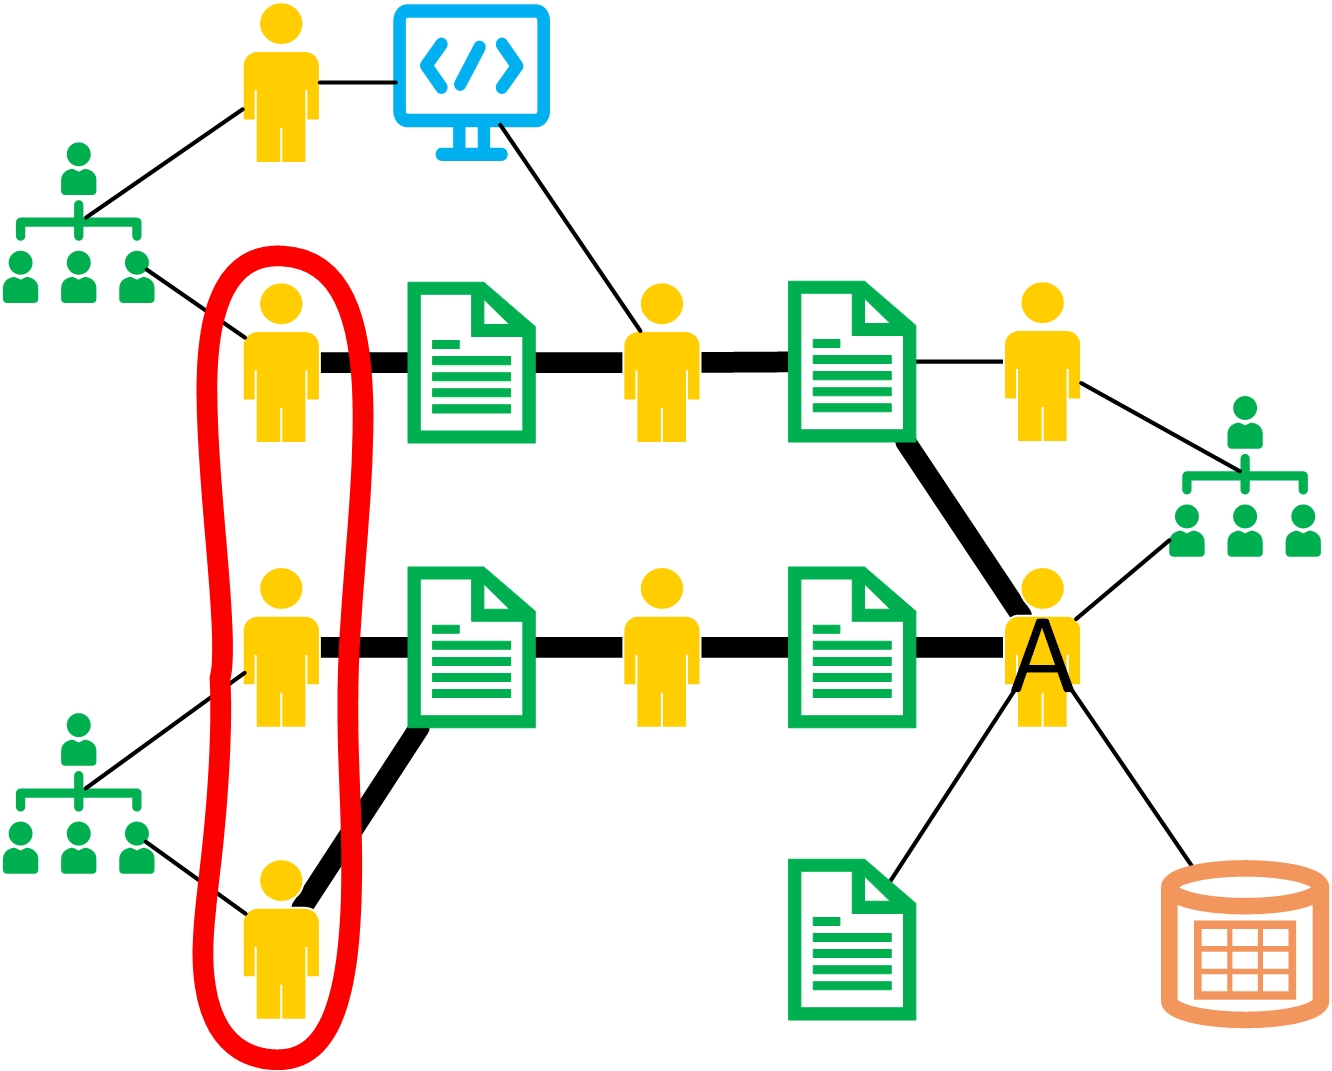
As a researcher A, I want to find researchers from other universities that have co-authored publications written by the co-authors of my own publications, so that I can read their publications to find out if we share common research interests. The items surrounded by the red line are the solution to this use case.
4 Main contributions of Ricgraph
- Ricgraph can store many types of items in a single graph.
- Ricgraph harvests multiple source systems into a single graph.
- Ricgraph Explorer is the exploration tool for Ricgraph.
- Ricgraph facilitates reasoning about items because it infers new relations between items.
- Ricgraph can be tailored for an application area.
5 Why Ricgraph?
Ricgraph can answer questions like:
- Which researcher has contributed to which publication, dataset, software package, project, etc.?
- Given e.g. a dataset, software package, or project, who has contributed to it?
- What identifiers does a researcher have (e.g. ORCID, ISNI, organization employee ID, email address)?
- What skills does a researcher have?
- Show a network of researchers who have worked together?
- Which organizations have worked together?
Also, more elaborate information can be found using Ricgraph and Ricgraph Explorer, the exploration tool for Ricgraph:
- You can find information about persons or their results in a (sub-)organization (unit, department, faculty, university). For example, you can find out what data sets or software are produced in your faculty. Or the skills of all persons in your department. Of course this is only possible in case you have harvested them.
- You can find out with whom a person shares research output types. For example, you can find out with whom someone shares software or data sets.
- You can get tables showing how you can enrich a source system based on other systems you have harvested. For example, suppose you have harvested both Research Information System Pure and OpenAlex, using this feature you can find out which publications in OpenAlex are not in Pure. You might want to add those to Pure.
- You can get a table that shows the overlap in harvests from different source systems. For example, after a query to show all ORCID nodes, the table summarizes the number of ORCID nodes which were only found in one source, and which were found in multiple sources. Another table gives a detailed overview how many nodes originate from which different source systems. Then, you can drill down by clicking on a number in one of these two tables to find the nodes corresponding to that number.
If you would like to get this information programmatically, you can use the Ricgraph REST API.
With Ricgraph, you can get metadata from objects from any source system you’d like. You run the harvest script for that system, and data will be imported in Ricgraph and will be combined automatically with data which is already there. Ricgraph provides harvest scripts for the systems mentioned above. Scripts for other sources can be written easily.
6 Examples
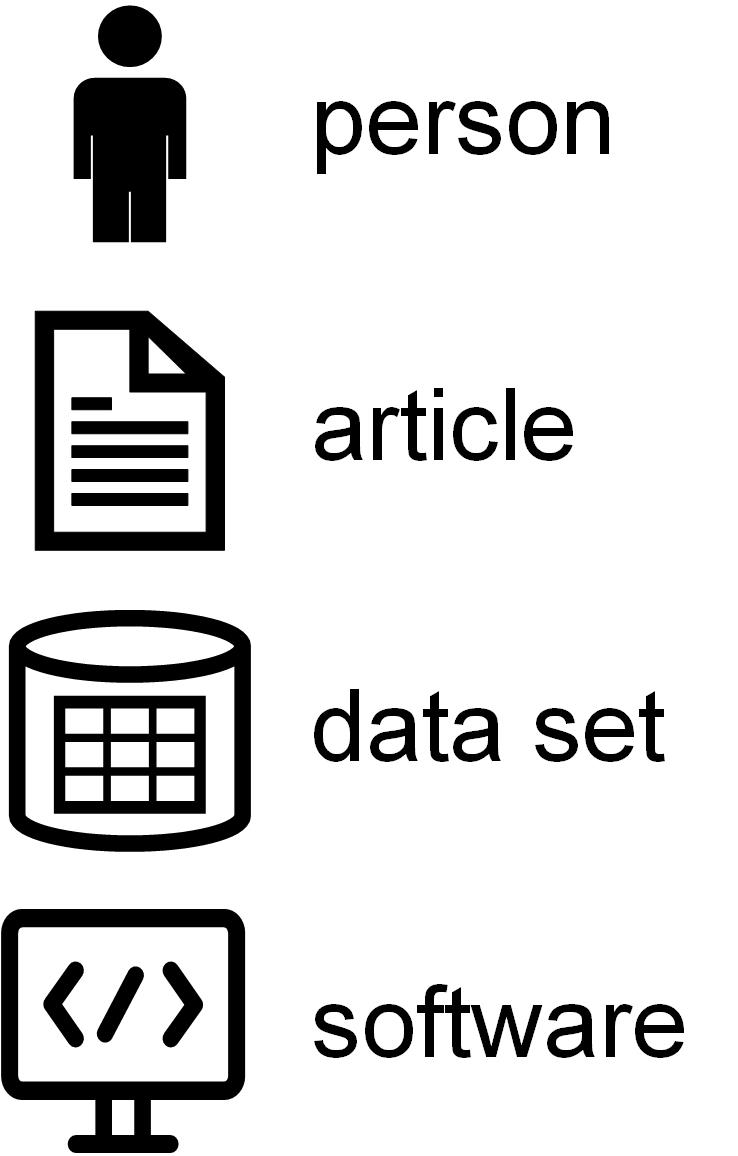
See the figures below for example graphs that show how Ricgraph works. In this section, we use the following symbols and colors.
| symbols for type of object | colors for source system |
|---|---|
 |
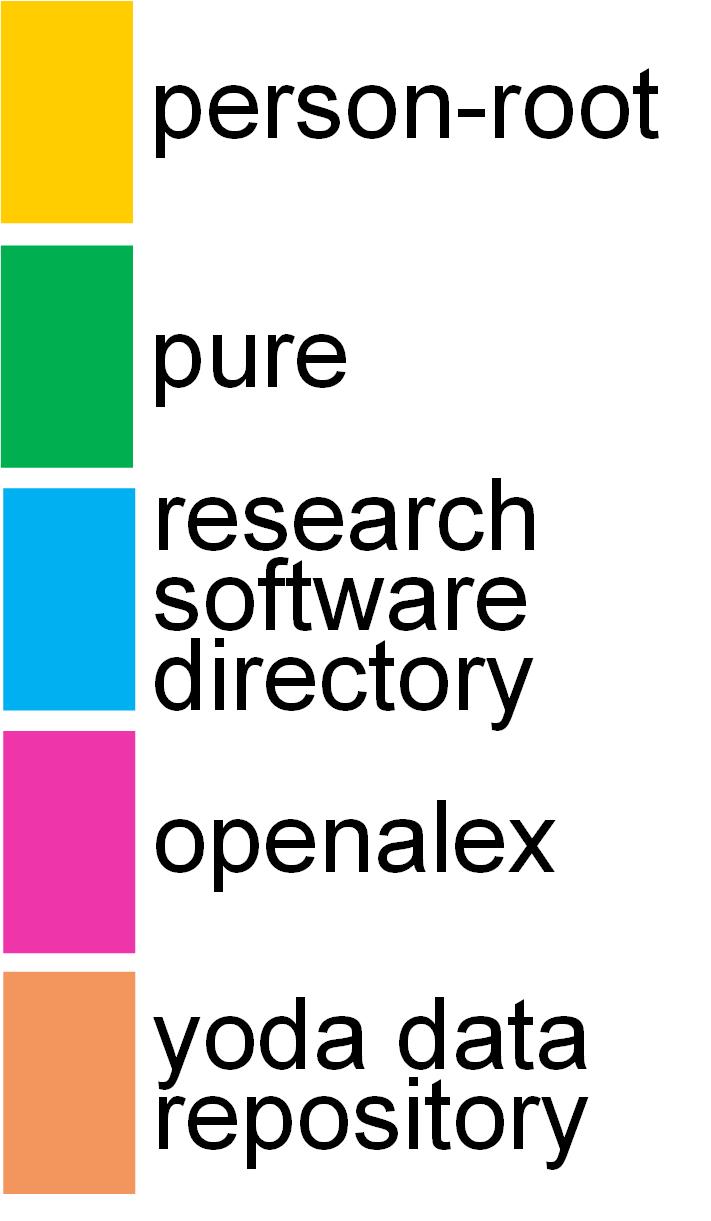 |
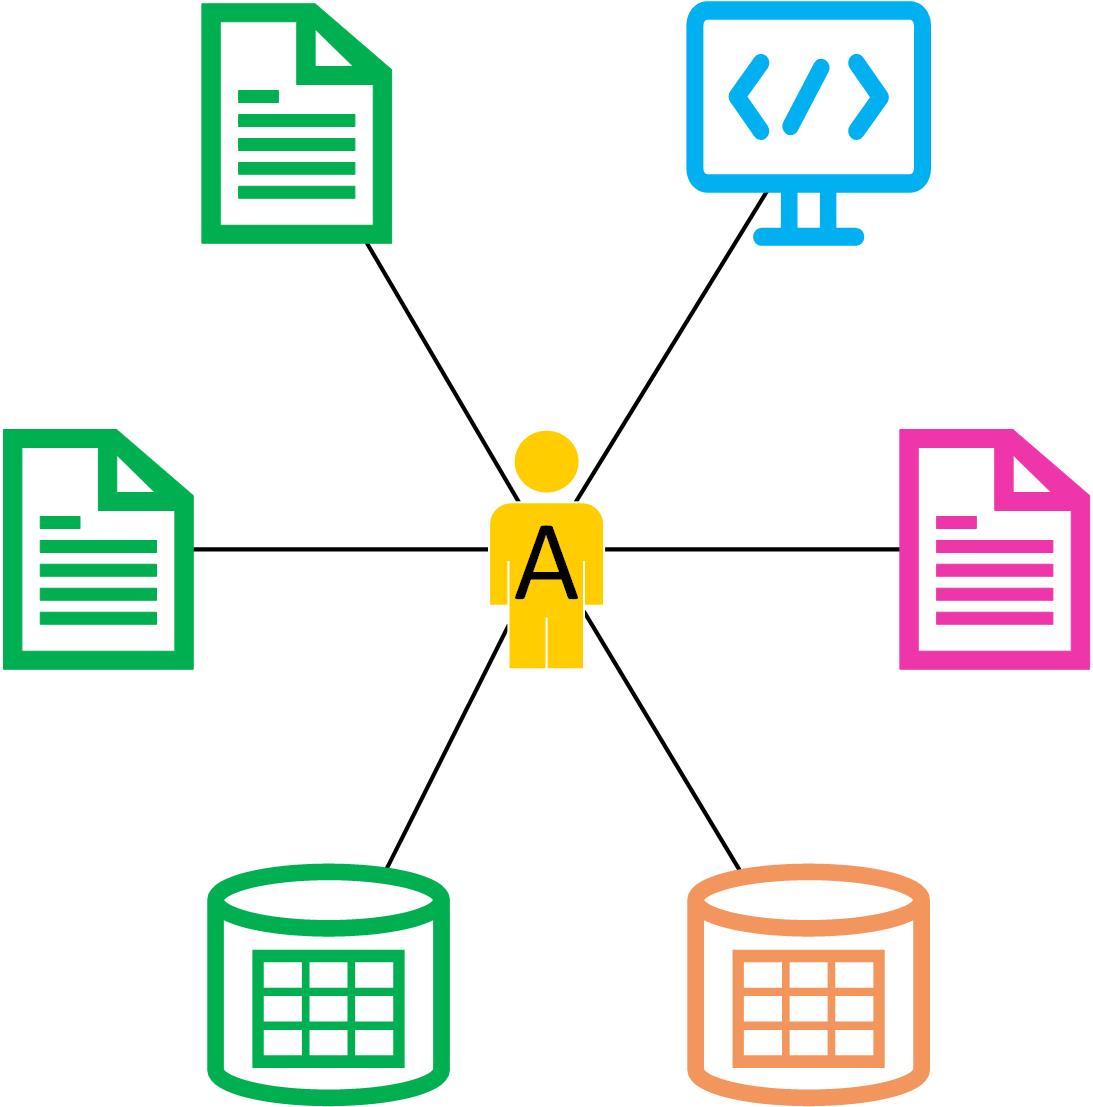
The following figure shows one person with several research outputs. It shows one person A using a person-root node, a node which “represents” a person as it is called in Ricgraph. This person has contributed to three articles, two data sets and one software package. Two articles and one data set are from the Research Information System Pure (their color is green), one data set is from the data repository Yoda (in orange), one article is from OpenAlex (in purple), and the software package is from the Research Software Directory (in blue).
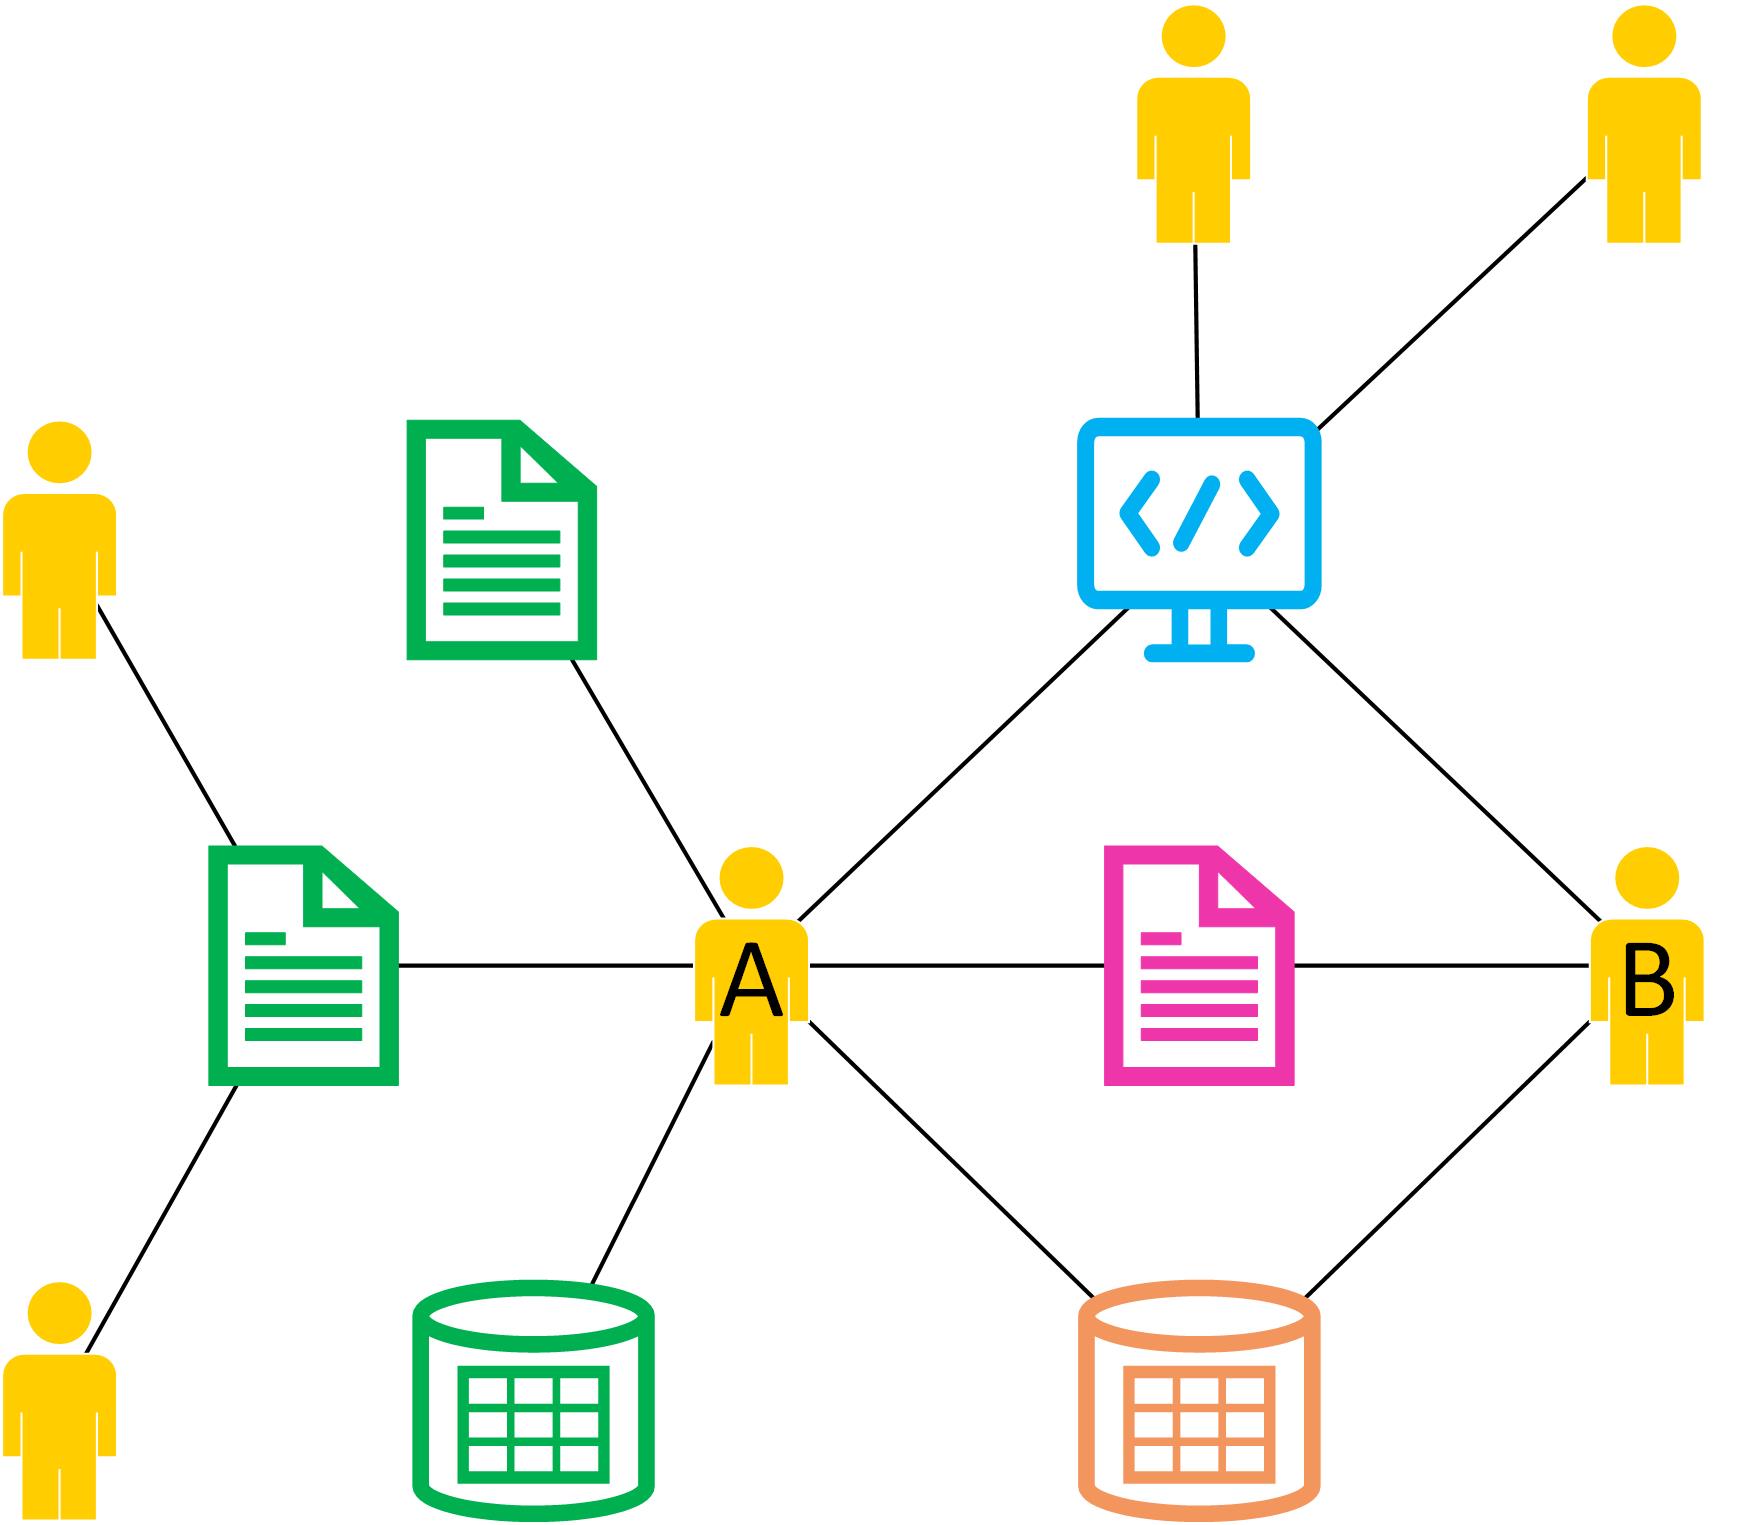
The following figure shows several persons with several research outputs (the symbols) and how these are related (i.e. which person contributed to which research output). It also shows from which source system these research outputs have originated (using different colors).
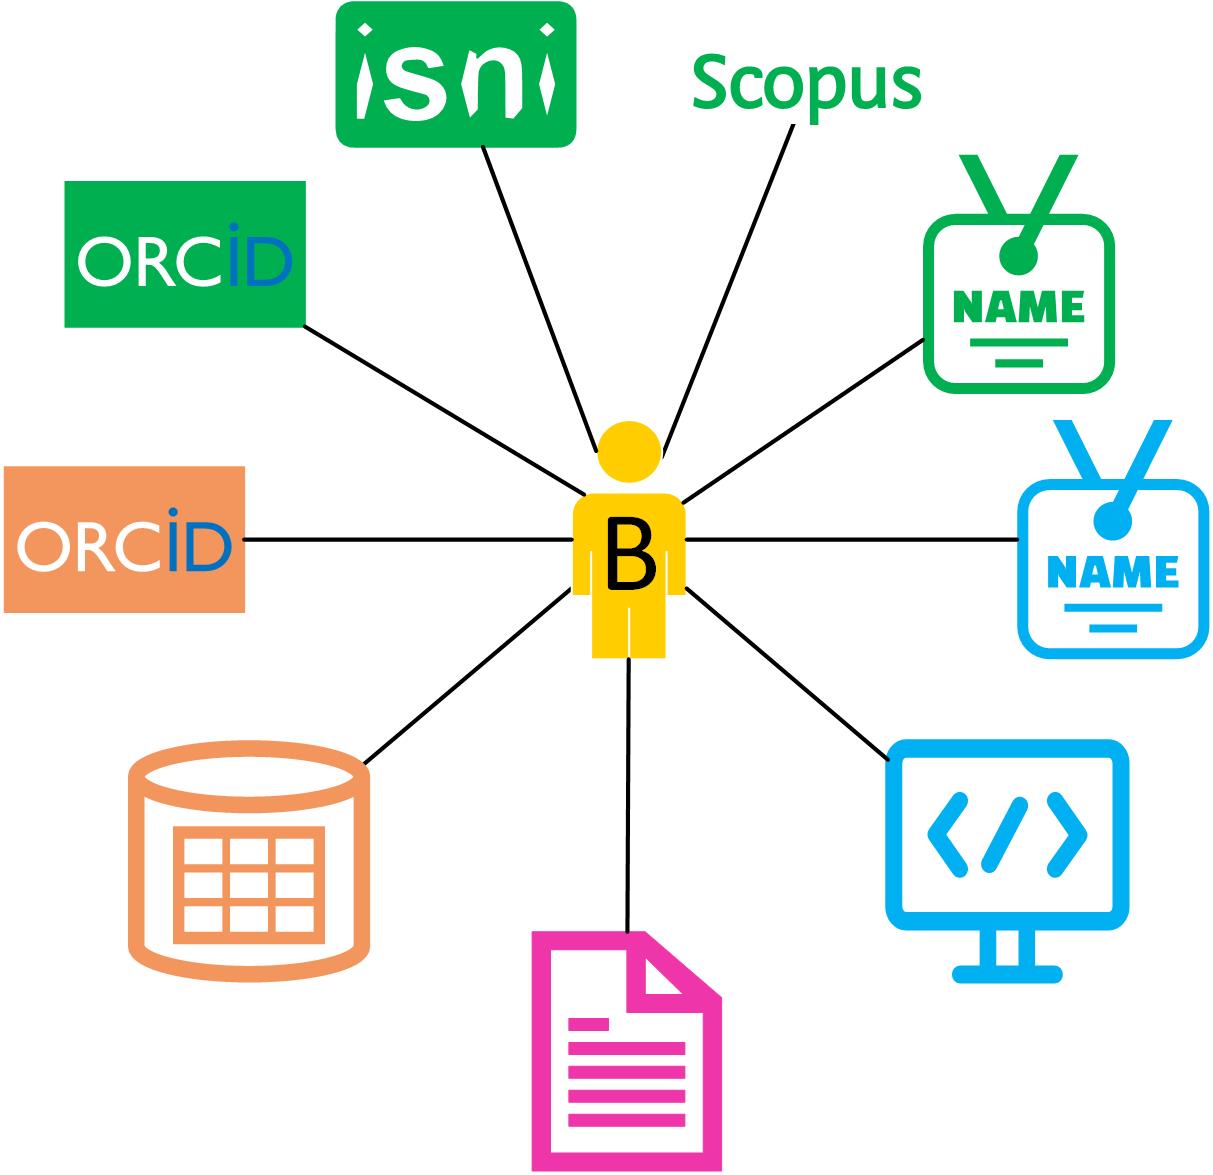
The following figure shows one person having several identifiers and several research outputs. This person has two different ORCIDs, one ISNI, one SCOPUS_AUTHOR_ID, and two FULL_NAMEs (which differ in spelling). These identifiers have also been obtained from different source systems, as their color indicates.
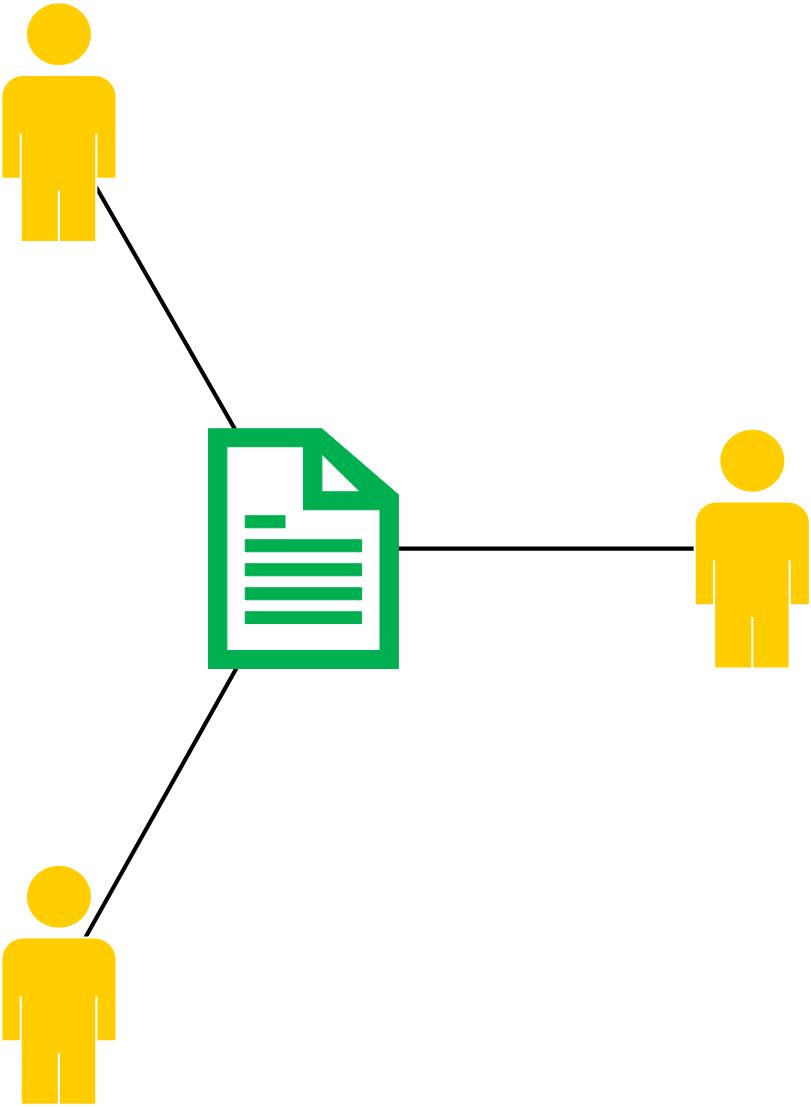
The following figure shows how three persons have contributed to one research output.
7 Ricgraph in bullet points
- The philosophy of Ricgraph is that it stores metadata, not the objects the metadata refer to. To access an object, a node has a link to that object in the system it was obtained from.
- We have chosen a graph as a data structure, since it is a logical and efficient method to access objects which are close to objects they have a relation to. For example, starting with a person, its research outputs are only one step away by following one edge, and other contributors to that research output are again one step (edge) away.
- Ricgraph can be used to store, manipulate and read metadata of any object that has a relation to another object, as long as every object can be “represented” by at least a name and a value. In Ricgraph, one node represents one object, and an edge represents the relation between two objects.
- Ricgraph and Ricgraph Explorer are written in Python. You can use two different graph database backends: Neo4j and Memgraph.
- The objective of Ricgraph is to get metadata from objects from a source system in a process called “harvesting”. That means that e.g. persons and publications can be harvested from one system, data sets from another system, and software from a third system. Everything found will be combined into one graph.
- Ricgraph can harvest from many sources, and you can write your own harvesting scripts. Example scripts are included to harvest from the OpenAlex, the Research Information System Pure, the data repository Yoda, the Research Software Directory, and for the Utrecht University staff pages.
- Ricgraph is an ID resolver. It can, given an identifier of a person, easily find other identifiers of that person. When new identifiers are found when harvesting from new systems, they will be added automatically.
- Ricgraph can enrich a source system based on information that is present in one source system, but not in another source system. See the librarian use case above.
8 Next steps
8.1 Further information about Ricgraph
- Explore the full documentation of Ricgraph on https://docs.ricgraph.eu.
- Play the Ricgraph use cases video, or the Ricgraph introduction video.
- For a gentle introduction in Ricgraph, read the reference publication: Rik D.T. Janssen (2024). Ricgraph: A flexible and extensible graph to explore research in context from various systems. SoftwareX, 26(101736). https://doi.org/10.1016/j.softx.2024.101736.
- We also have an article about collaborations and Ricgraph: Rik D.T. Janssen (2025). Utilizing Ricgraph to gain insights into research collaborations across institutions, at every organizational level. Submitted to SoftwareX [preprint]. https://doi.org/10.2139/ssrn.5524439.
- For a further introduction, you might want to read these two presentations:
- A general presentation about Ricgraph, presenting Ricgraph in a visual manner: https://doi.org/10.5281/zenodo.12634234.
- A presentation explaining how to enrich the Research Information System Pure (and other source systems) using Ricgraph and BackToPure: https://doi.org/10.5281/zenodo.12634658. This presentation explains that after harvesting several Pure systems (from different institutions) and other source systems, such as OpenAlex, one can enrich its own Pure A by using information in other source systems, not present in one’s own Pure A.
- Read more about publications, presentations, newsletters (to subscribe, go to Ricgraph Contact), projects with students, use, and mentions of Ricgraph.
- The Ricgraph main website is www.ricgraph.eu. Alternative sites are www.ricgraph.nl and www.ricgraph.com. These are generated using the ricgraph-documentation GitHub repository.
8.2 Steps to take if you would like to install Ricgraph and harvest data
- Install and configure Ricgraph.
- Start harvesting data, see Ricgraph harvest scripts, e.g. by doing a harvest for Utrecht University data sets and software. You will observe that the information from two sources is neatly combined into one graph.
- Unfortunately, there is a bug, see known bugs. This bug may occur if you start a harvest script, and as first step in the script you want to empty Ricgraph. In that case, a Python error might occur while emptying Ricgraph. Follow the link to read more and find out how to repair that.
8.3 Steps to take if you would like to use Ricgraph
- Use Ricgraph.
- Read more about Ricgraph Explorer, the exploration tool for Ricgraph.
- Use the Ricgraph REST API, the REST API for Ricgraph.
- You can also write your own harvest scripts, or modify any part of the Ricgraph code.
9 Contact
Ricgraph has been created and is being maintained by Rik D.T. Janssen from Utrecht University in the Netherlands. You can find contact details at his Utrecht University employee page. He also has an ORCID profile on ORCID 0000-0001-9510-0802. You can contact him for presentations, demos and workshops.
He is also very interested in working together on projects involving Ricgraph. Ricgraph is a flexible platform that brings together information from multiple systems into a single graph. It allows users to analyze this information and explore how it relates to other types of information. We could work together on use cases applying Ricgraph to research information, such as exploring collaborations or analyzing how people or organizations contribute to research results. We could also explore entirely different domains. Any application that involves representing and analyzing interconnected information as nodes and relations in a graph, regardless of the field, is of interest.
About three to four times a year we send out a newsletter. Please click here to subscribe to it. Your email program will open with a subscribe email text. Please complete it by filling in your name and email address. We also have a newsletter archive.
If you like Ricgraph, please give it a GitHub Star by clicking on the top right Star button on the Ricgraph GitHub page https://github.com/UtrechtUniversity/ricgraph. If you have any suggestions or improvements, please let me know by creating a GitHub Issue at the top left of that page.
This README.md file is part of the documentation for version 3.3 of Ricgraph - Research in context graph.