Research in context graph, Ricgraph, Ricgraph Explorer, Ricgraph REST API, Data enrichment, Data harvesting, Data linking, Enrichment, Graph, Graph database, Harvest, Harvest data, Harvester, Knowledge graph, Linked data, Metadata, Utrecht University, Visualization
Subject: Ricgraph newsletter October 2025
Sent: Wednesday, 1 October 2025 08:18
Dear colleague,
This newsletter tells you about some recent developments around Ricgraph. You can find the following information:
- What is Ricgraph.
- Pilot project Open Ricgraph demo server is operational.
- New article: Utilizing Ricgraph to gain insights into research collaborations across institutions.
- Ricgraph projects with students.
- Contouren open science infrastructuur.
- Other information that might be of interest.
If you would like to have a presentation or demo, or would like to discuss how Ricgraph can help you for your specific use case, please do not hesitate to contact me. Please feel free to share this newsletter with anyone you might think is interested.
What is Ricgraph
Ricgraph (www.ricgraph.eu), also known as Research in context graph, enables the exploration of researchers, teams, their results, collaborations, skills, projects, and the relations between these items.
Ricgraph can store many types of items into a single graph. These items can be obtained from various systems and from multiple organizations. Ricgraph facilitates reasoning about these items because it infers new relations between items, relations that are not present in any of the separate source systems. Ricgraph is flexible and extensible, and can be adapted to new application areas.
Pilot project Open Ricgraph demo server is operational
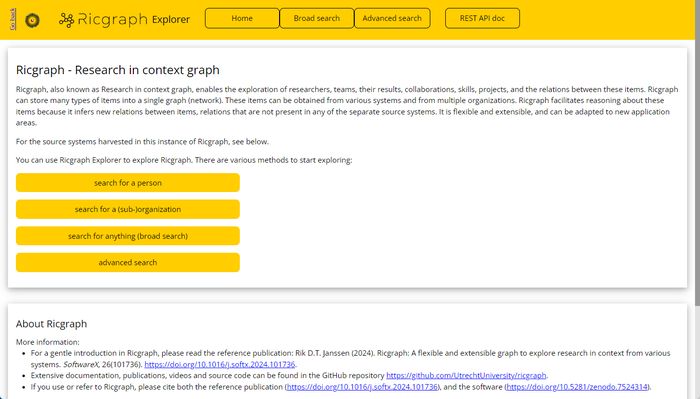
The pilot project Open Ricgraph demo server is now operational! It is filled with research information from Delft University of Technology (thanks!), and you can access it on https://explorer.ricgraph.eu.
The aim of this pilot is to demonstrate how a knowledge graph can provide insights into research relations and collaborations, and how it can optimize the quality of research information. We will focus on:
- Participating organizations can enrich Pure data using Ricgraph and BackToPure. BackToPure can insert (enrich) items from an organization that are absent from the Pure of that organization but are present in another source, back into the Pure of that organization.
- Participating organizations can explore collaborations between sub-organizations (faculties, departments, chairs) using Ricgraph. Also see the article below.
To read more: Discovering insights from cross-organizational research information and collaborations: A pilot project using Ricgraph, Rik D.T. Janssen (2025), https://doi.org/10.5281/zenodo.15637647.
The Open Ricgraph demo server can also contain research information from your organization! I have already invited three other Dutch universities. To learn how to participate, please read https://www.ricgraph.eu/pilot-project-open-ricgraph-demo-server.html or contact me.
New article: Utilizing Ricgraph to gain insights into research collaborations across institutions
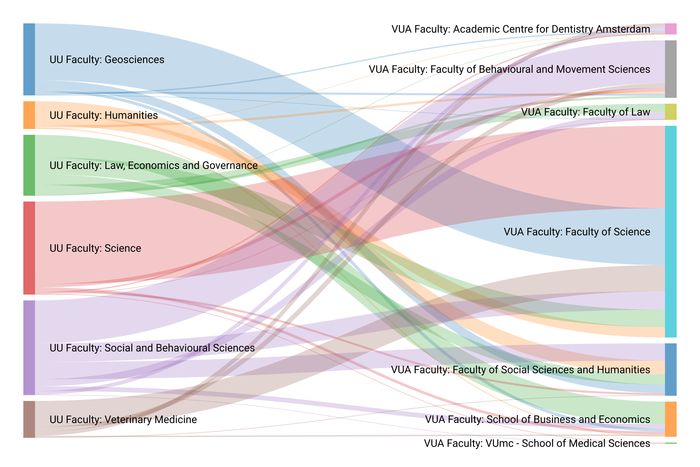
Overview of publication collaborations (2022 – July 2025) between UU faculties and VUA faculties. It has a total of 1139 collaborations.
Last week I have submitted a new article to PLOS One: Rik D.T. Janssen (2025), Utilizing Ricgraph to gain insights into research collaborations across institutions, at every organizational level. You can find the preprint on: https://doi.org/10.2139/ssrn.5524439.
Abstract
“In a research organization, researchers rarely work alone. They work with colleagues from their own and other organizations, often across multidisciplinary boundaries. That means that there are a lot of collaborations between persons and organizations, on various levels, within and between research organizations. This article describes methods and software that can be used to drill down on these collaborations and find their research results, their sub-organizations, or the persons that contributed to them.
Researchers can use information about their partnerships to see with which groups they do and do not work together. This can help them strengthen existing collaborations or initiate promising new ones. They can assess the state-of-the-art in a research discipline. For management, partnerships may reveal insights in the diversity and multidisciplinarity of research within their organization. Diversity and multidisciplinary are key indicators of innovation, creativity, performance, talent attraction, reputation, and societal impact.
In this article, we use Ricgraph (Research in context graph), software that enables the exploration of all kinds of research information, as well as the relations between these items. It combines data from various systems and multiple organizations, and stores it in a single graph. This design allows to infer new relations, relations that are not present in any of the separate source systems. As a result, a wider variety of analytical approaches can be supported than would be possible with data from one source system.”
The published article will include interactive figures for Figs 6 – 11 that you can browse and hover with your web browser. They are listed as “Supporting information”. I was not able to upload them to the preprint server. Please send me an email if you would like to have them.
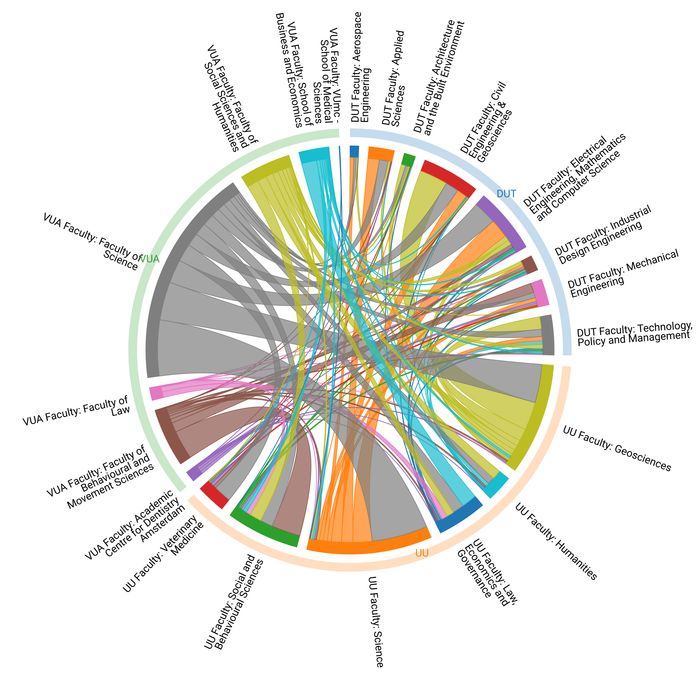
Overview of publication collaborations (2022 – July 2025) between faculties of UU, VUA, and DUT.
[For larger versions of these figures, please read the preprint.]
Ricgraph projects with students
There are several projects with the University of applied sciences Utrecht (HU). At the moment, there is one student project running, two projects are in the approval phase, and one will start in October.
- A “innovation project” with six 3rd and 4th years students, for 5 months: General harvester for Ricgraph.
- A 3rd year internship (“stage”), for 5 months: Development of a modern frontend-backend user interface for Ricgraph.
- A 4th year graduation project (“afstudeerproject”), for 5 months: Using AI and LLM techniques to find topics and visualize large amounts of research information.
- A 2nd year short project, for a few weeks: Security scan of Ricgraph.
All of these projects will have (do have) a project description at https://docs.ricgraph.eu/docs/ricgraph_outreach.html#ricgraph-projects-with-students. For the first project, the description can already be read. The other project descriptions will be added when they have been approved and started.
Contouren open science infrastructuur
[Parts of this section will be in Dutch.] In August, the “Landelijk overleg Open Science” has published the document: Contouren open science infrastructuur, Strategisch plan integrale infrastructuur voor open science deel 1 [in Dutch]. Thanks to FW who brought this to my attention! Read more at: https://www.universiteitenvannederland.nl/actueel/nieuws/denk-mee-over-de-nederlandse-open-science-infrastructuur. Download the report from https://www.universiteitenvannederland.nl/files/publications/SPII%20Deel%201%20Versie%201.0_0.pdf.
Its aim is:
“Het doel van het Strategisch Plan Integrale Infrastructuur Open Science (SPII) is het ontwikkelen van een plan voor een samenhangende, federatieve infrastructuur die onderzoekers en instellingen ondersteunt bij het faciliteren van Open Science. De aanleiding is het ontbreken van een gemeenschappelijk kader voor een Open Science Infrastructuur (OSI), hetgeen het risico van versnippering met zich meebrengt. SPII beoogt een gemeenschappelijk gedragen streefbeeld en streefarchitectuur te ontwikkelen dat een sturende en harmoniserende werking heeft zodat er stapsgewijs een adequate, landelijke Open Science Infrastructuur kan worden gerealiseerd. […]
Beschrijving open science infrastructuur componenten:
- Research administratie en compliance met regelgeving.
- Optimalisatie- en efficiëntieslag CRIS/repositories en inzet als publicatiekanaal.
- Infrastructuur delen en hergebruik (sensitieve) onderzoeksdata.
- Infrastructuur delen en hergebruik research software.
- Open research informatie, discovery en actieve disseminatie.”
2 is about Optimalisatie en efficiëntieverbetering van de huidige CRIS/repository systemen, Inzetten van de CRIS/repositories infrastructuur als publicatiekanaal, Institutionele CRIS systemen en een nationaal repository, Archivering en long-term preservation, and Beschikbaarstelling voor breed publiek (p. 25-26).
5 is about Tellers en metrics, Metadatahub, Discovery layer, and Actieve disseminatie (p. 33-34).
I think Ricgraph can be used to help realize parts of components 2 and 5. For optimization of CRIS systems, Ricgraph can enhance information in one CRIS, based on other information sources (using BackToPure and the external organization cleaning tools that are being developed, see www.ricgraph.eu), and it of course has a user interface (that surely needs to be enhanced for “het brede publiek”). It can help with research assessment (for an example see the article above). Most of this is possible because Ricgraph combines data from various systems and multiple organizations, and stores it in a single graph. This design allows to infer new relations, relations that are not present in any of the separate source systems.
We will try to help realize the open science infrastructure.
Other information that might be of interest
- Website: https://www.ricgraph.eu.
- Documentation website: https://docs.ricgraph.eu.
- Reference publication: Rik D.T. Janssen (2024). Ricgraph: A flexible and extensible graph to explore research in context from various systems. SoftwareX, 26(101736). https://doi.org/10.1016/j.softx.2024.101736.
- Ricgraph is now on version v3.0. To see a full overview of all changes, go to the releases page: https://github.com/UtrechtUniversity/ricgraph/releases.
If you would like to have a presentation or demo, or would like to discuss how Ricgraph can help you for your specific use case, please do not hesitate to contact me. Please feel free to share this newsletter with anyone you might think is interested.
This newsletter has been sent to you because we have had a previous communication about Ricgraph. Please let me know if you would like to be removed from this list (or if you want to be added to it, if someone forwarded it to you). There will be about 2 to 3 newsletters per year about Ricgraph.
To subscribe to the newsletter email list, go to Ricgraph Contact.
Back to top